Getting Started (Download tutorial, Contact us for demo account!)
Background
Capillary gel electrophoresis (CE) is a proven sensitive high-throughput, high-resolution system for nucleic acid analysis. Other than Sanger sequencing, it was traditionally applied as “fragment analysis” for AFLP, MLPA, and SNP detection, etc.
In most recent CRISPR/Cas9 genome editing studies, multiple CE-based assays have been developed and reported as a fast, sensitive, precise and cost effective approach for mutation detection, such as IDAA (Indel Detection by Amplicon Analysis), Fluorescent PCR, CRISPR-STAT, etc. The CE instruments with Sanger sequencing capability (e.g. Thermo Fisher 3130 and 3730 series) are different from the ones without the capability (e.g. AATI Fragment Analyzer). The former instruments can reach single base resolution. The mutation screening assays (IDAA, Fluorescent PCR, CRISPR-STAT), developed on these types of instruments, are with simple protocol (two-step: PCR-CE) independent on enzyme cleavage . It reported that the sensitivity and resolution is comparable to NGS with an indel detection sensitivity ≈0.1% (Lonowski et al., 2017) , which can be applied in in basic research and more challenging genome editing applications such as therapeutic indel profiling.
Moreover, it has been reported as “using CE as an analytical tool fundamentally changes the scale and complexity of experimental design” (Gardner et al., 2016 ). Based on this publication, high-throughput CE assays based on fluorescent labeled oligonucleotides can be designed to in-depth characterize/discovery/engineer/screen nucleic acid metabolic enzymes (ligases, polymerases, exonuclease, RNase H2, etc.), including study on DNA repair, recombination, restriction and modification and RNA metabolism. It also claimed “Restriction endonuclease site specificities and reaction parameters can be determined using a panel of fluorescently labeled substrates containing variable recognition sequences.” Furthermore, it has been applied as reagent quality control assays.
GeneMapper is the supplier (Thermo Fisher) software to run the instrument and process the data. Peak Scanner is a free alternative software from the same supplier for data processing. There are also several similar softwares on the market. From 2017, free cloud version of Peak Scanner is available from Thermo Fisher. There is no limiting factor for primary CE data process anymore (baselining, peak detection and sizing). However, none of them can fully satisfy the data analysis (fragment labeling and quantification, especially targeting efficiency calculation for genome editing study) requirements for above new applications. The bottleneck is quantitative post-processing data from instruments instead of experiments.
The solution provided here is not a me-too solution for GeneMapper. Instead, it is an add-on (or secondary) data processing to adapt for broad analytical applications . Users can keep using their predefined peak detection settings (algorithms and parameters) to ensure the data processing integrity. The software fills the gap between the instrument output raw data to the final scientific insights. It can significantly speed up data analysis and reduce turnaround time.
The videos in Video Gallery are good resources for you to understand the software and data analysis.
The algorithms embedded in the SaaS solution are universal. Contact us if you need customized solution from other brands’ CE instruments.
Requirements
CSV output files from GeneMapper or Peak Scanner or GeneMarker software are required for fragment analysis.
Two analysis algorithms
Two analysis algorithms are available for data analysis, Quantitative fragment (peak) percentage is calculated based on peak area.
- Single basepair resolution: For analysis with single basepair difference, for example, genome eiditing with 1bp insertion or deletion, dA tailing efficiency evaluation.
- Standard algorithm: For all the other cases, including the case with continous fragments grouping for anaysis.
Sample naming rule
There are no specfic requirements for sample names if you do not use the statistical analysis feature.
Sample naming rule for automatic statistical analysis and plotting is following:
- Use ”-” as a separator for each sample name.
- Prefix is highly recommended to be 2-digit or 3-digit index, e.g. from 01, 02 to 96. This is convenient for sample display in a certain order.
- Sample replicates are grouped by three ways: prefix only, suffix only, prefix and suffix.
- Examples of sample name with grouped by prefix only (recommended): 01-sample1-20C, 02-sample1-20C, 03-sample1-20C.
- Examples of sample name with grouped by suffix only: sample1-20C-1, sample1-20C-2, sample1-20C-3.
- Examples of sample name with grouped by both prefix and suffix (recommended): 04-sample1-20C-1, 05-sample1-20C-2, 06-sample1-20C-3.
Standard Algorithm
Analysis Settings
- Based on the data review, design fragment analysis set. Click ”New Analysis Set” to input design information. For the new users, please refer to FAQ for more details of analysis set design. Contact us if you need help for design.
- Click “New Fragment Analysis”.
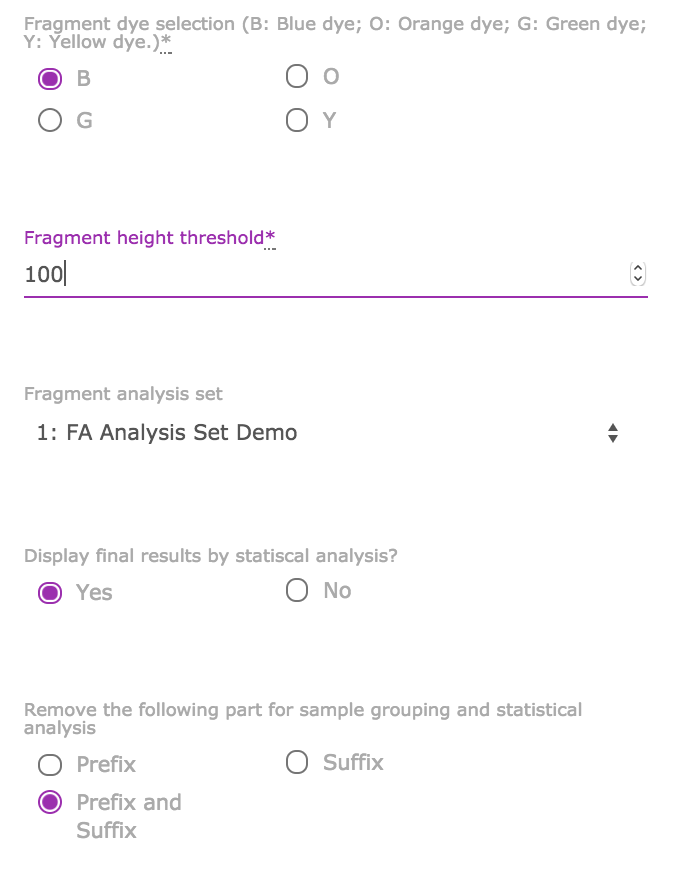
- Fill in the required information as following:
- Fragment dye selection: The dye you used for your oligos. For example, FAM is a blue dye (choose B here).
- Fragment height threshold: Any fragments with peak height lower than the threshold (exclusive) are considered as instrument noises instead of real signal. The noises fragments are filtered out of the further analysis. It is recommended to set the threshold in the range of 100 to 500 for dye B, depending on the experimental data. Refer to the following site for threshold setting up.
- Fragment analysis set: Choose your predefined analysis set.
- Click “Create Fragment Analysis” to get the results.
Results review
Results review
- If you see some waring message like the following, you need to investigate your analysis set design: Warning: 75 % of tested samples ( 9/ 12 ) with fragments above threshold (100 ) but not selected by analysis set.
- You can always re-analyze the fragments with current settings by click “Reparse Fragments” button. When you update the analysis set contents (not only the name), click this button to re-analyze the data.
- Important: Click the “Results Table” to view the results by sample.The results and figures (including statistical analysis) will be displayed.
Single Basepair Analysis
Analysis settings
- Adjust the analysis settings at GeneMapper or Peak Scanner to have correct fragment/peak calling for the single basepair analysis. Contact us if you need help for settings.
- Click “Single Basepair Analysis”.
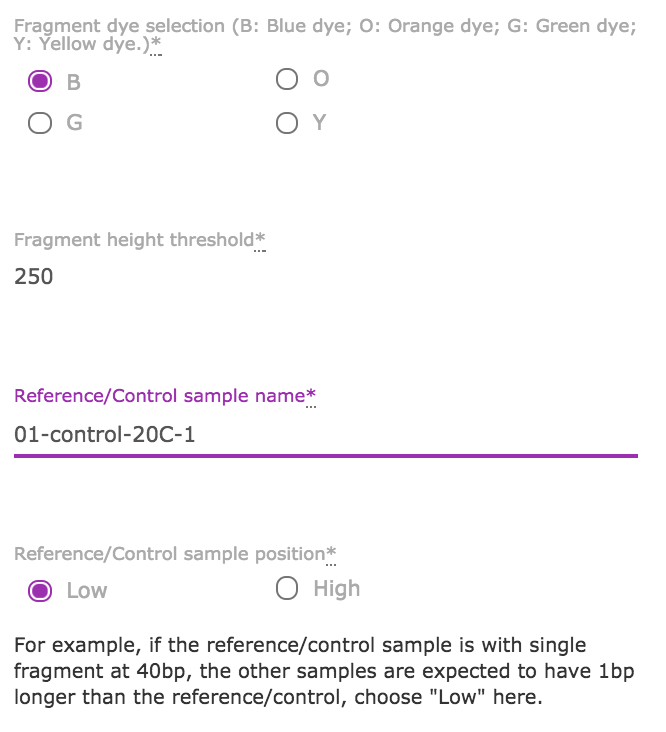
- Fill in the required information as following:
- Fragment dye selection: Same description as “standard algorithm”.
- Fragment height threshold: Same description as “standard algorithm”.
- Reference/control sample name: If you have replicated run controls, choose only one to input here.
- Reference/control sample position: Choose ”Low” if your reference sample has smaller size of basepairs.
- Click “Create Fragment Analysis” to get the results.
Results review
- The selected fragments are labeled as ”Low” and “High”, all the other fragments are labeled as “Invalid”.
- You can search the table by “Invalid” to get all non-selected fragments to ensure that there are no critical fragments with wrong classification.
- You can always re-analyze the fragments with current settings by click “Reparse Fragments” button.
- Important: Click the “Results Table” to view the results by sample.The results and figures (including statistical analysis) will be displayed.
Analysis Set Design
Definition
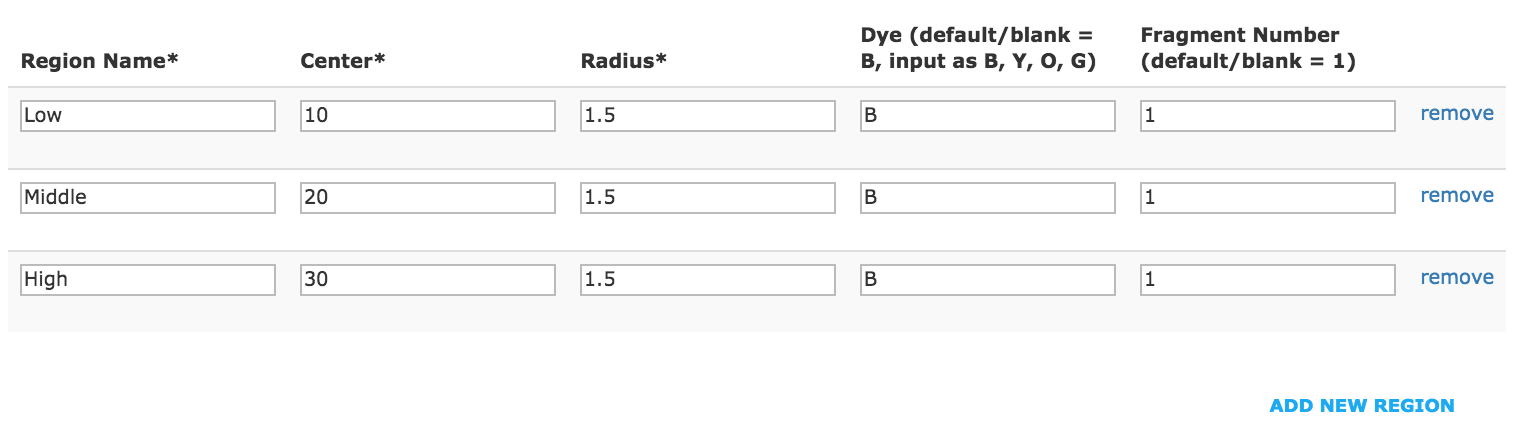
- Each analysis set includes one or multiple predefined regions for data analysis.
- Each region is defined to capture/label one or multiple fragments/peaks.
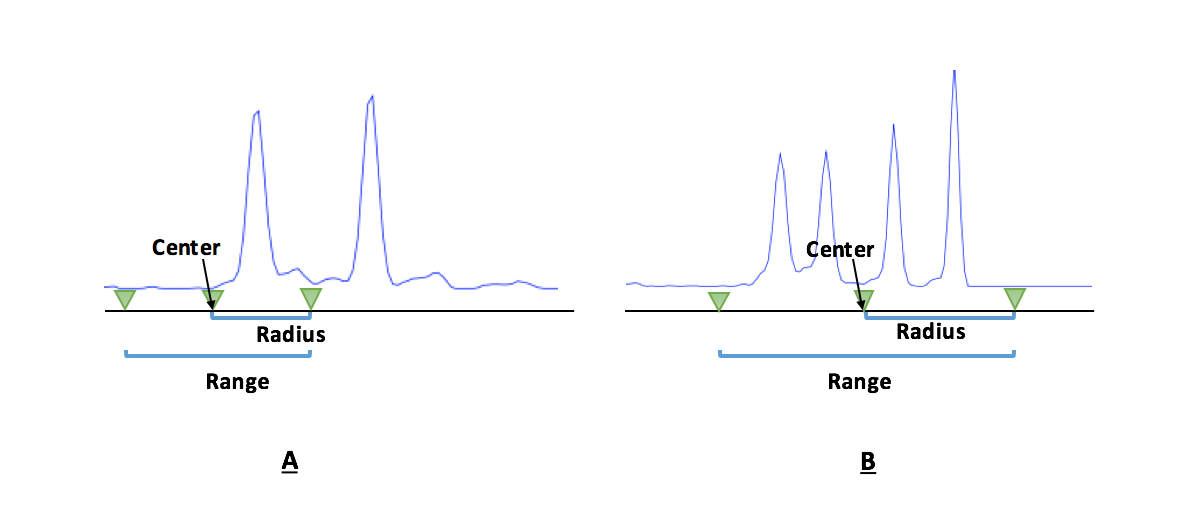
- Region center and radius are defined in terms of peak size (in bp).
- For each region, the analysis range is from "center" - "radius" to "center" + "radius".
- Ensure the selected fragment fall inside the range of designed region.
- The region range cannot be overlapped between adjacent regions.
- Only one kind of dye (B, Y, O, G) can be input for each analysis set. Contact us if you need multiplex analysis.
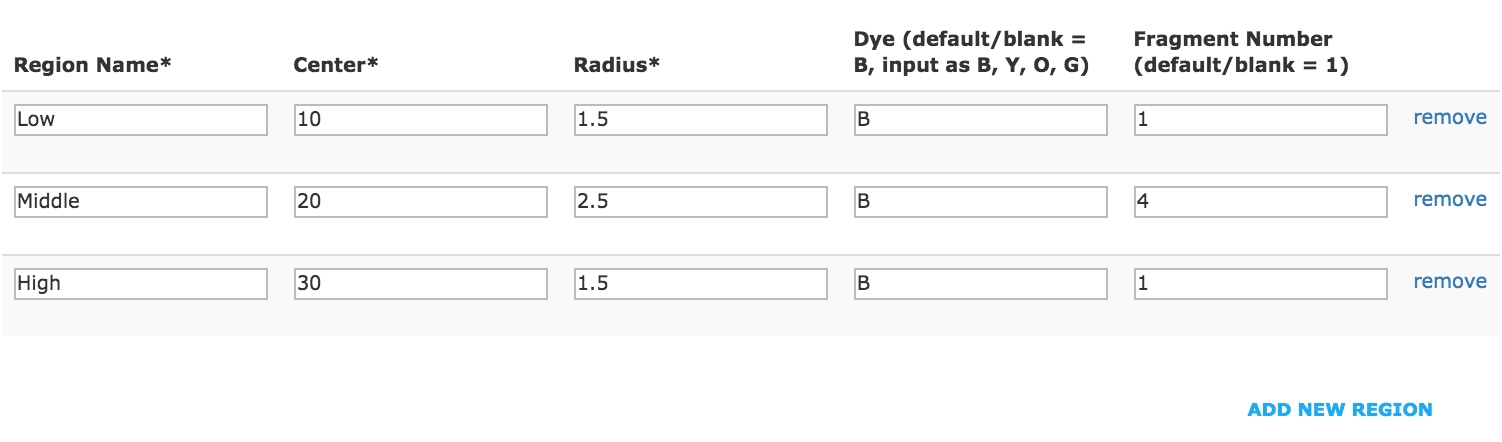
- Figure A: Example of analysis design, each region is designed to select top 1 (in terms of peak height) fragment in the designed range. Input as fragment number = 1.
- Figure B: Example of analysis design, each region is designed to select top several (in terms of peak height) fragments in the designed range. For this case, if the fragment number is 4 or more, all fragments are selected. If the fragment number is 3, only the top 3 fragments are selected.
- An analysis set can includes several regions like the cases shown in figure A and B.
Design
- Click “New Analysis Set”.
- Example of analysis set with single fragment selection for each region.
- Example of analysis set with different number of fragments selection for each region.
- Click “Save” to create an analysis set.
References
Instructions about instruments:
- Fragment Analysis -- the Other Half of your Applied Biosystems' Genetic Analyzer
- How does Fragment Analysis work?
Instructions about instrument software:
- DNA Fragment Analysis by Capillary Electrophoresis
- Peak Scanner™ Software 2.0 User Guide
- New: Peak Scanner™ Cloud Solution(Sign in ThermoFisher website to use)
Reports about applications:
Molecular diagnostics- Asuragen: AmplideX® PCR/CE C9orf72 Kit
- Targeted, High-Depth, Next-Generation Sequencing of Cancer Genes in Formalin-Fixed, Paraffin-Embedded and Fine-Needle Aspiration Tumor Specimens
- Multiplexed Identification of Blood-Borne Bacterial Pathogens by Use of a Novel 16S rRNA Gene PCR-Ligase Detection Reaction-Capillary Electrophoresis Assay
-
Indel Detection by Amplicon Analysis (IDAA)
- Fast and sensitive detection of indels induced by precise gene targeting
- Genome editing using FACS enrichment of nuclease-expressing cells and indel detection by amplicon analysis Fluorescent PCR
- High-throughput genotyping of CRISPR/Cas9-mediated mutants using fluorescent PCR-capillary gel electrophoresis
- A Medium-Throughput Single Cell CRISPR-Cas9 Assay to Assess Gene Essentiality
- Using a Fluorescent PCR-capillary Gel Electrophoresis Technique to Genotype CRISPR/Cas9-mediated Knockout Mutants in a High-throughput Format CRISPR-STAT
- CRISPR-STAT: an easy and reliable PCR-based method to evaluate target-specific sgRNA activity
- Analysis of off-target effects of CRISPR/Cas-derived RNA-guided endonucleases and nickases
- New England Biolabs application note: cloning and synthetic biology
- Adapting capillary gel electrophoresis as a sensitive, high-throughput method to accelerate characterization of nucleic acid metabolic enzymes
- Substrate specificity and mismatch discrimination in DNA ligases
- A high-throughput assay for the comprehensive profiling of DNA ligase fidelity
- Sensitive and specific miRNA detection method using SplintR ligase